Bar chart maker for publication-ready figures
Compare categories with a bar chart that looks right in a journal or a report. Upload a table, choose the columns and export. Your file is never sent to or stored on a server.
Open SimplePub and upload your data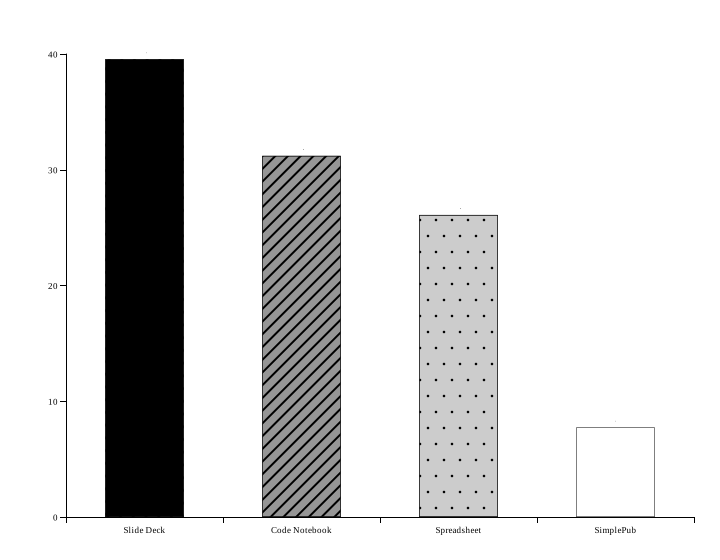
What your data should look like
One column of category names and one or more numeric columns. Several numeric columns give grouped bars. Typical uses are comparing means across conditions, counts by category and survey results.
SimplePub reads CSV, Excel, TSV, JSON and Parquet files.
What you get
- Grouped bars with a clear legend
- Axis labels, units and titles you control
- Fonts and line weights that follow journal guidelines
- Vector export (SVG, PDF, EPS) for papers, plus PNG for slides
Free, private, no account
SimplePub runs in your browser. Your data is never sent to or stored on our servers, and there is nothing to sign up for. Export PNG, SVG, PDF or EPS.
Make your bar chart maker figure