Pie and donut chart maker
Show how a total splits into parts with a pie or donut chart. Upload a table, pick the labels and values, and export. Your file stays in your browser.
Open SimplePub and upload your data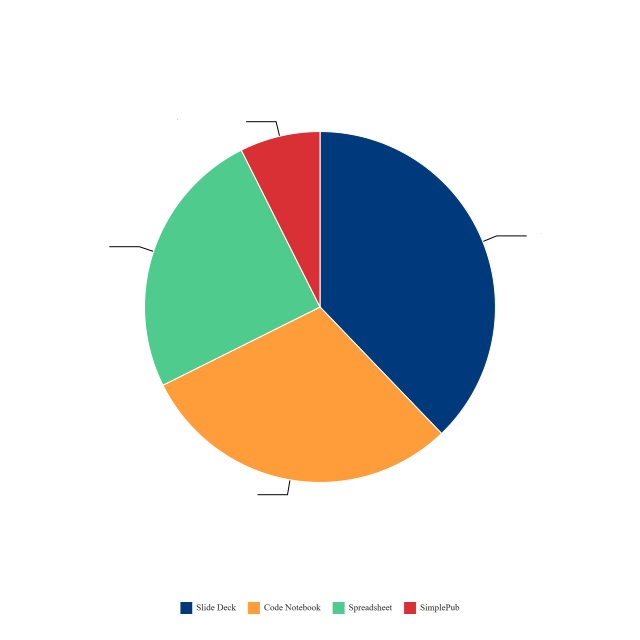
What your data should look like
One column of labels and one numeric column of values. Values are turned into shares of the total. Pie charts read best with a handful of slices, so group small categories together first.
SimplePub reads CSV, Excel, TSV, JSON and Parquet files.
What you get
- Pie or donut layout
- Labels and percentages you can show or hide
- Colour palettes with enough contrast between neighbouring slices
- Vector export (SVG, PDF, EPS) for papers, plus PNG for slides
Free, private, no account
SimplePub runs in your browser. Your data is never sent to or stored on our servers, and there is nothing to sign up for. Export PNG, SVG, PDF or EPS.
Make your pie chart maker figure