Box plot maker for papers and theses
Compare distributions across groups with a box plot built from your raw values. SimplePub works out the quartiles and whiskers, and your file is never sent to or stored on our servers.
Open SimplePub and upload your data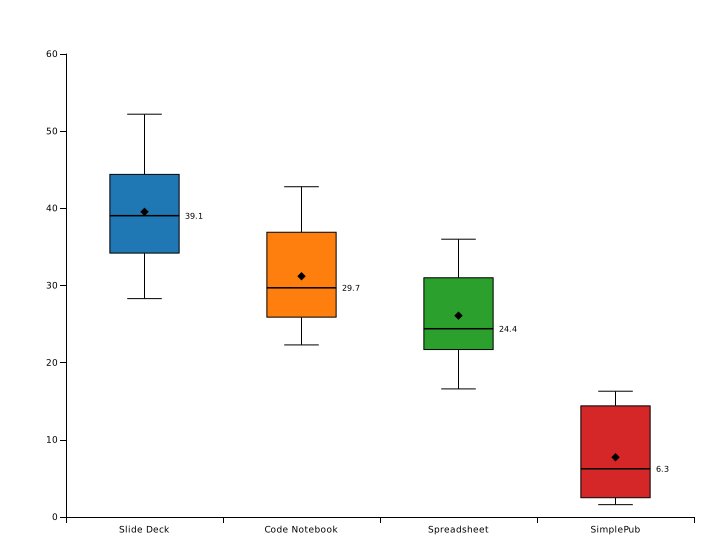
What your data should look like
A group column and a value column with one row per observation, or one column of raw values per group. You supply raw data, not pre-computed quartiles. Typical uses are treatment versus control and measurements across conditions.
SimplePub reads CSV, Excel, TSV, JSON and Parquet files.
What you get
- Median, quartiles and whiskers calculated from your raw values
- Side-by-side groups with consistent colours
- Labels and units you control on both axes
- Vector export (SVG, PDF, EPS) for papers, plus PNG for slides
Free, private, no account
SimplePub runs in your browser. Your data is never sent to or stored on our servers, and there is nothing to sign up for. Export PNG, SVG, PDF or EPS.
Make your box plot maker figure