Line graph maker for papers and reports
Upload a table, pick the columns for the x-axis and each line, and export a figure that is ready for a manuscript. Nothing leaves your browser.
Open SimplePub and upload your data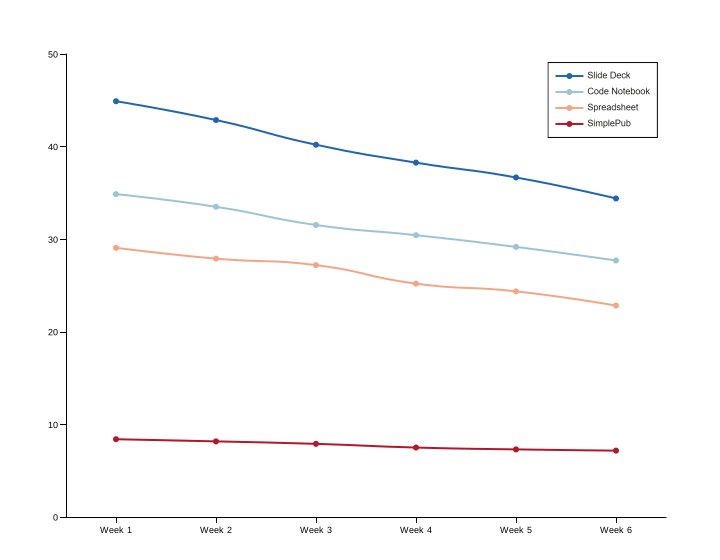
What your data should look like
One column for the x-axis (time, dose, step) and one column per series. Long format with a series-name column also works. Typical uses are time series, growth curves and training curves.
SimplePub reads CSV, Excel, TSV, JSON and Parquet files.
What you get
- Multiple series with distinct colours and line styles
- Axis labels, units and titles you control
- Consistent fonts and line weights that match journal guidelines
- Vector export (SVG, PDF, EPS) for papers, plus PNG for slides
Free, private, no account
SimplePub runs in your browser. Your data is never sent to or stored on our servers, and there is nothing to sign up for. Export PNG, SVG, PDF or EPS.
Make your line graph maker figure